Quickstart
This simple example demonstrates the basics of PathSim by integrating a cosine function to produce a sine wave.
Setup
First, install PathSim via pip:
pip install pathsim
or conda:
conda install conda-forge::pathsim
then import the necessary modules:
[1]:
import numpy as np
import matplotlib.pyplot as plt

from pathsim import Simulation, Connection
from pathsim.blocks import Source, Integrator, Scope

# Apply custom plotting style
plt.style.use('pathsim_docs.mplstyle')
Build the System
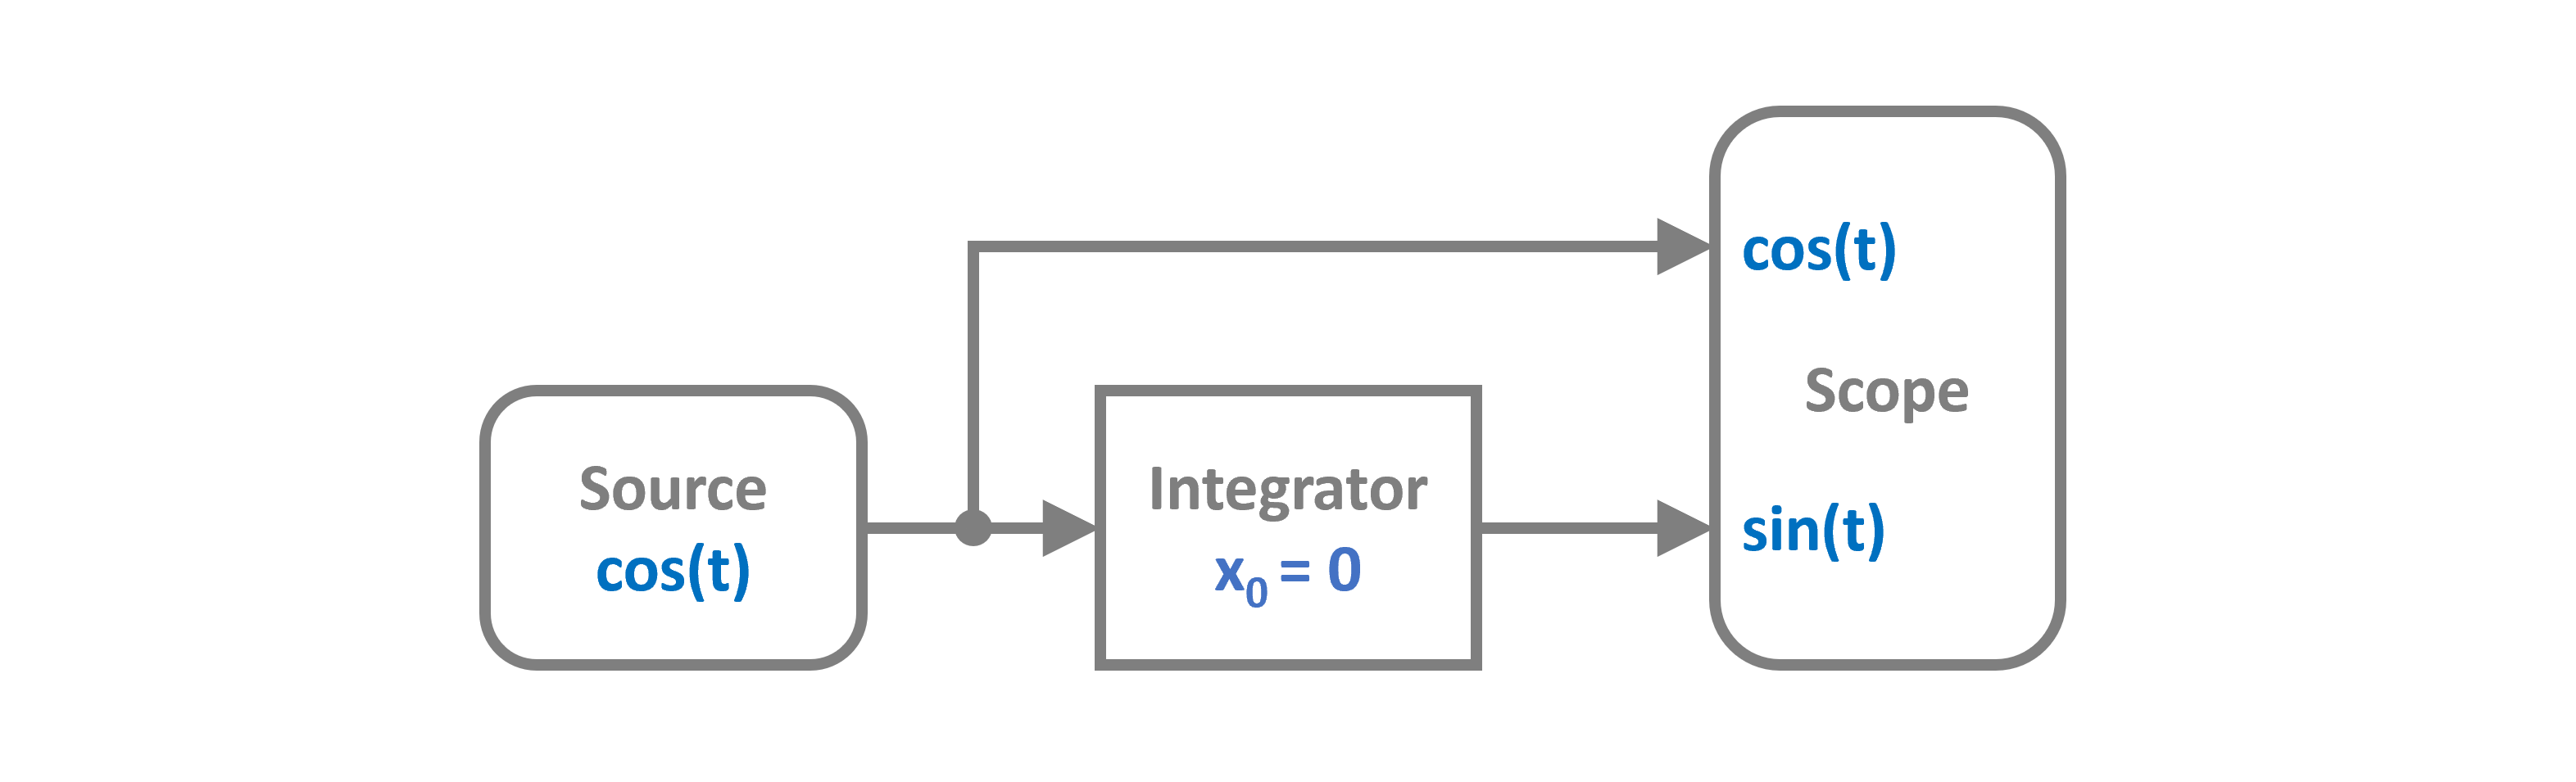
Define the blocks that make up our system:
[2]:
# Define the blocks of our system
Sr = Source(np.cos)                    # Source block that outputs cos(t)
In = Integrator()                       # Integrator block
Sc = Scope(labels=["cos", "sin"])      # Scope to record signals
Create the Simulation
Connect the blocks and create a simulation instance:
[3]:
# Create simulation with blocks and connections
Sim = Simulation(
    blocks=[Sr, In, Sc],
    connections=[
        Connection(Sr, In),      # cosine → integrator
        Connection(Sr, Sc[0]),   # cosine → scope channel 0
        Connection(In, Sc[1]),   # sine → scope channel 1
    ],
    dt=0.01
)
08:30:56 - INFO - LOGGING (log: True)
08:30:56 - INFO - BLOCKS (total: 3, dynamic: 1, static: 2, eventful: 0)
08:30:56 - INFO - GRAPH (nodes: 3, edges: 3, alg. depth: 1, loop depth: 0, runtime: 0.029ms)
Run and Visualize
Execute the simulation for 10 time units and plot the results:
[4]:
# Run for 10 time units
Sim.run(10)

# Plot the scope
Sc.plot(lw=2)
plt.show()
08:30:56 - INFO - STARTING -> TRANSIENT (Duration: 10.00s)
08:30:56 - INFO - --------------------   1% | 0.0s<0.1s | 15873.5 it/s
08:30:56 - INFO - ####----------------  20% | 0.0s<0.0s | 20813.4 it/s
08:30:56 - INFO - ########------------  40% | 0.0s<0.0s | 19316.4 it/s
08:30:56 - INFO - ############--------  60% | 0.1s<0.1s | 7045.9 it/s
08:30:56 - INFO - ################----  80% | 0.1s<0.0s | 6789.1 it/s
08:30:56 - INFO - #################### 100% | 0.1s<--:-- | 6862.7 it/s
08:30:56 - INFO - FINISHED -> TRANSIENT (total steps: 1001, successful: 1001, runtime: 125.69 ms)

The plot shows both the original cosine wave and the integrated sine wave, demonstrating how PathSim can simulate continuous-time systems through block-based modeling.